On Clarity in Performance Reporting
Clarity in performance reporting is not a presentation problem. It is a design problem. When analytical structure, performance management, and governance are left implicit, reporting stabilises around compliance and narrative – not understanding, action, or learning.
1. Why Clarity Matters Uniquely in Performance Reporting
Clarity matters in any analysis.
In performance reporting, it must be designed, because the work is recurring and institutional.
Unlike one-off analysis or exploratory work, performance reporting is institutionalised and recurring. It runs on a fixed cadence – weekly, monthly, quarterly, or annually – and is consumed by the same audiences repeatedly. Over time, it shapes how performance is understood, discussed, and acted upon.
Performance reporting is a recurring system, and like any recurring system, it inevitably trains its audience:
- what to pay attention to
- what to ignore
- what questions are considered legitimate
- which explanations are considered acceptable
- and what does – or does not – lead to action
When clarity is weak, minor distortions do not cancel out – they compound.
Over time, this training effect drifts away from understanding and towards reassurance, narrative management, and compliance signalling. The report becomes a behavioural artefact, not just an informational one.
This is why clarity in performance reporting cannot be reduced to presentation or communication skill.
It is a system property.
In performance reporting, clarity is institutional – it persists across cycles, audiences, and personnel, without needing to be rebuilt each cycle.
In practice, clarity fails for three predictable reasons – two are design omissions; the third is an organisational constraint:
- measures are defined, but analysis logic is not
- reports are designed, but performance management is not
- governance capacity is uneven, so narrative becomes the safest control surface (“safest” here refers to the lowest-risk lever available inside a fixed reporting design – not an intent to mislead)
The result is a system that can publish performance, but struggles to sustain shared understanding of it.
If analytical structure is unclear, commentary fills the gap.
If references are unstable, interpretation replaces inspection.
If meaning is not explicit, narrative becomes negotiable.
And because the process repeats, these patterns harden into routine.
What begins as a pragmatic workaround becomes “how reporting works here”.
2. Performance Reporting as a Chain: The Design Layer and Execution Cycle
Performance reporting is often discussed as an artefact – a dashboard, a slide pack, a set of KPIs, or a monthly or quarterly report.
In practice, it is none of these in isolation.
Performance reporting operates as a chain of interdependent activities. Some are established infrequently as part of the design layer; others repeat continuously as part of the execution cycle. Clarity – or the lack of it – is embedded across this chain and replayed over time.
To understand where clarity is created and where it is lost, it helps to view performance reporting from two complementary angles:
- the design layer, where intent, meaning, and structure are set
- the recurring execution cycle, where those definitions are repeatedly applied, interpreted, and acted upon
Decisions made early in the design layer do not fade into the background. They are operationalised – and often amplified – through every execution cycle.
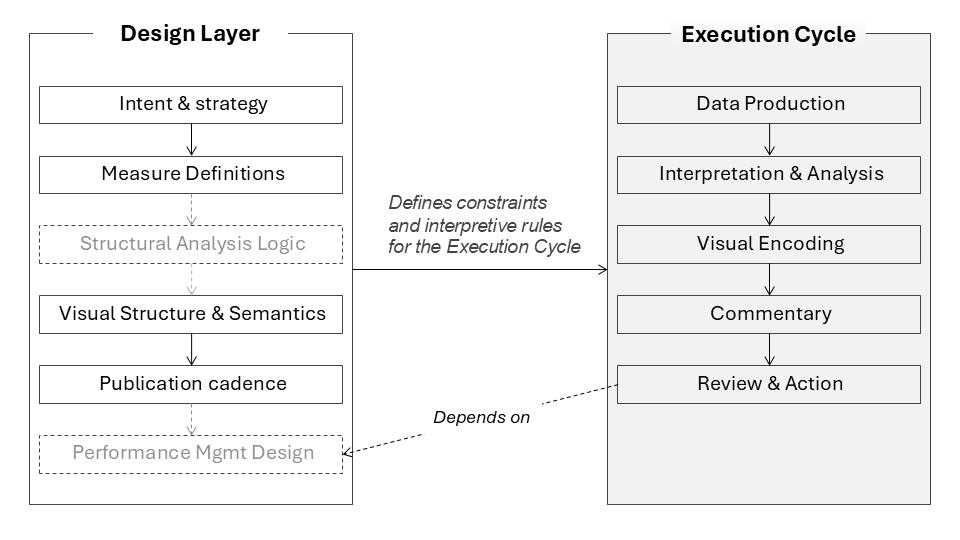
2.1 The Design Layer: where meaning and structure are set
The design layer consists of decisions that establish the foundations of performance reporting. These decisions are made infrequently, but their effects are replayed in every execution cycle.
These typically include:
- Intent and strategic priorities
Why performance is being monitored, and the organisational questions the system is expected to answer. - Values and dimensions to be measured
What “performance” is taken to mean: outcomes and drivers, financial and non-financial dimensions, and their intended relationships. - KPI selection and definitions
What is chosen to represent performance – and, just as importantly, what is excluded. Calculation logic and data dictionaries. - Benchmarks, targets, and thresholds
How success, failure, and exception are framed and normalised. - Visual structure and layout
The agreed architecture of dashboards and reports: grouping, sequencing, stable comparisons, chart types, and layout conventions that determine what can be seen. - Publication cadence and audiences
Reporting frequency, timing, and intended audiences, establishing the rhythm through which performance is reviewed and acted upon.
These decisions are often treated as setup or delivery decisions. They define the semantic, analytical, and visual constraints within which all subsequent reporting is interpreted.
Why visual structure matters upstream
Visual structure and layout are often treated as presentation choices. In a recurring reporting system, they function instead as analytical constraints.
The layout determines:
- which comparisons are immediately visible
- which relationships must be explained verbally
- which questions can be asked by inspection
- and which questions require justification or defence
Once a visual structure is agreed, it becomes difficult to challenge within the execution cycle. Analysts and business owners rarely feel authorised to change layout or structure period by period, even when the structure no longer serves understanding.
As a result, when clarity is insufficient, effort does not flow into redesigning the visual architecture. It flows into commentary.
This dynamic is not accidental. It is a predictable consequence of the design layer:
- visual structure is perceived as “fixed”
- meaning still needs to be resolved
- narrative becomes the remaining control surface
Over time, explanation accumulates around a stable but weak structure, rather than the structure being strengthened to reduce the need for explanation.
Two common omissions in the design layer that systematically degrade clarity
In practice, two elements are frequently missing from the design-layer work.
First, organisations define KPIs and measures, but rarely specify the structural analysis expected for those measures: the comparisons that matter, the decompositions that are valid, the drivers that should be examined, and what constitutes a meaningful explanation. Interpretation is therefore deferred to the execution cycle and handled ad hoc, by individuals rather than by design.
Second, organisations often design reporting, but leave performance management undefined: how results will be reviewed, how actions will be agreed, how follow-up will occur, and how outcomes will be evaluated.
Because performance reporting is recurring, these omissions are not neutral. They are replayed in every cycle, and their effects compound over time.
Other omissions and distortions commonly emerge elsewhere in the chain, and are examined in later sections.
2.2 The Execution Cycle: where meaning is replayed under pressure
The execution cycle consists of activities that repeat on each period.
These typically include:
- Data production and consolidation
Generating KPI and measure results for the period. - Analytical interpretation
Examining trends, comparisons, drivers, and relationships – formally or informally. - Visual encoding
Translating results and analysis into charts, tables, dashboards, and layouts. - Commentary and explanation
Providing narrative to frame performance for the audience. - Review, discussion, and action
Performance conversations, decisions, and agreed responses.
The execution cycle does not redefine performance.
It operationalises what has already been defined.
Any ambiguity embedded upstream – in intent, measures, analysis expectations, or management design – is reproduced through repetition. When clarity is weak in the design layer, the execution cycle compensates through commentary, interpretation, and visual emphasis.
Why clarity problems persist
Many clarity problems are addressed within the execution cycle by adding commentary, because other design choices have already been fixed upstream.
When clarity problems originate in the design layer, downstream adjustments are constrained. Commentary can explain, contextualise, or soften results, but it cannot correct ambiguous meanings, missing analysis logic, or absent management processes. The execution cycle can only operationalise what it has been given.
Seen this way, performance reporting as a chain – spanning one-off set-up and recurring execution – one implication follows:
most clarity problems do not begin in the report itself.
They are designed upstream, and reinforced through repetition.
Most clarity failures are not reporting failures. They are design omissions, replayed under cadence.
3. The Team Behind Performance Reporting: A Role Without a Settled Identity
Once performance reporting is understood as a chain rather than a report, a practical question follows:
who is responsible for holding the chain together?
In many organisations, this question has no stable answer.
Unlike Finance, whose role is institutionally anchored, the team responsible for performance reporting often lacks a settled identity. Its name, mandate, and reporting line vary across organisations – and often change over time within the same organisation.
The team may be labelled:
- Reporting & Analytics
- Business Intelligence
- Performance Reporting
- Organisational Performance
- Strategy & Insights
- Data & Insights
This variability reflects a deeper ambiguity about what the role is expected to do.
Drifting homes, drifting expectations
Performance reporting teams are commonly moved between functions, often without a change in the nature of the work itself. These shifts reflect a change in how the organisation currently interprets the purpose of reporting:
- into IT, when reporting is treated primarily as a data and systems function
- into Finance, when emphasis shifts towards control, assurance, and governance compliance
- into Strategy / Performance, when reporting is expected to interpret results against strategic intent and support structured performance review and action
Each placement reflects a different mental model of performance reporting – and a different definition of what “good” looks like.
- IT: data reliability, tool stability, and delivery timeliness.
- Finance: reconciliation, sign-off, and governance compliance.
- Strategy / Performance: insight, interpretation, and action.
None of these perspectives is inherently wrong.
But none, on its own, is sufficient to sustain clarity across the full reporting chain.
When these mental models compete, the system optimises for what is easiest to govern (timeliness, completeness) and neglects what is decisive (inspectable reasoning and follow-through to action).
An unsettled boundary: finance versus performance
Underlying the organisational drift is a persistent boundary question:
is performance reporting about non-financial performance, or about overall organisational performance?
In some settings, financial performance is treated as the domain of Finance, while “performance reporting” is assumed to focus on operational, customer, or workforce metrics. In others, performance is understood more holistically, encompassing financial outcomes alongside non-financial drivers, risks, and constraints.
When this boundary is not explicit, reporting structures oscillate. The function moves in search of an organisational home that can accommodate conflicting expectations – without fully resolving them.
The result is a role that is continuously reshaped, but rarely redefined.
Accountable for outputs, not for clarity
Because the purpose of performance reporting is often unsettled, reporting teams are held accountable for producing reports rather than defining how performance should be interpreted.
In practice, this means:
- KPIs are defined elsewhere
- measures and thresholds are agreed through governance forums
- commentary is written by business units being measured
- analytical reasoning is informal and variable
Reporting teams consolidate, format, and publish – expected to be objective, but without explicit authority to challenge definitions, assumptions, or narratives.
Teams are evaluated on what is easy to observe and govern:
- timeliness
- completeness
- consistency
rather than on what actually matters for decision support:
- analytical rigour
- coherence of interpretation
- visibility of reasoning
Clarity becomes an outcome that everyone wants, but no one is explicitly responsible for.
Instability is a signal
From a clarity perspective, the repeated movement and renaming of performance reporting teams is a signal: the organisation has not settled whether performance reporting exists primarily to publish results, provide assurance, explain outcomes, or support decisions.
Until that is resolved, no reporting line will feel quite right.
And the burden of creating clarity will continue to fall on individuals, rather than being designed into the system.
4. The Compliance Trap: When Reporting Substitutes for Understanding
When the design layer is incomplete and responsibility for clarity is diffuse, the system does not collapse. It stabilises – but around the wrong objective.
In many organisations, performance reporting converges on compliance.
Not compliance in a narrow regulatory sense, but a broader institutional pattern:
producing outputs that satisfy formal requirements, provide assurance to stakeholders, and withstand scrutiny – without necessarily improving understanding.
This is not a deliberate choice. It is the predictable outcome of a recurring reporting system operating under governance pressure. In many settings, this is an appropriate priority for external accountability – the trap forms when it becomes the dominant internal optimisation, at the expense of intervention and learning.
Compliance becomes a trap when reporting is optimised for defensibility – delivering short-term safety at the cost of long-term learning.
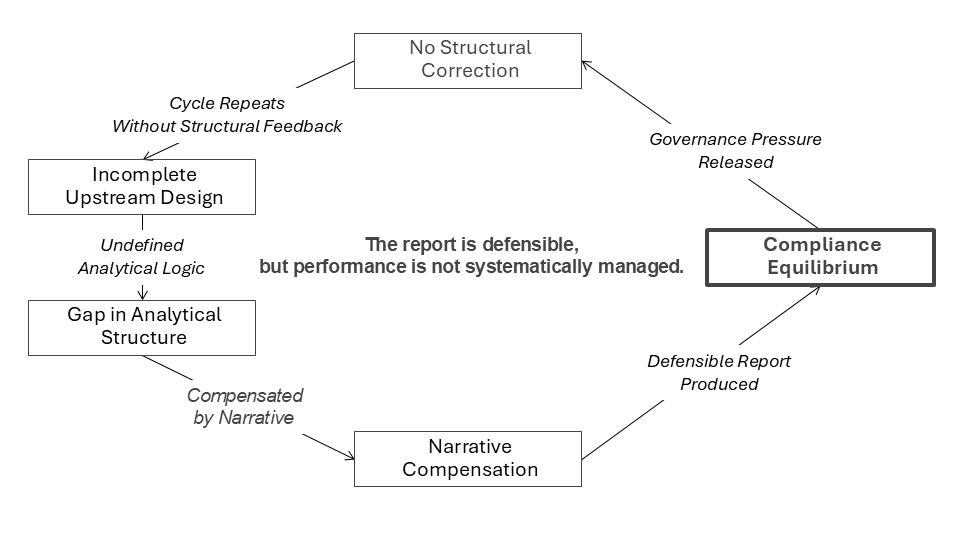
How the compliance trap forms
The compliance trap emerges through the interaction of three conditions already described.
First, the design layer focuses on definitional completeness rather than interpretive clarity.
KPIs, measures, thresholds, layouts, and cadence are agreed – but structural analysis expectations and performance management processes are left unspecified.
Second, the execution cycle has limited levers.
Once measures, formats, and schedules are fixed upstream, the only element that can be adjusted within each cycle is commentary.
Third, accountability is asymmetric.
Results are visible, explanations are scrutinised, but the quality of analytical reasoning is rarely governed with the same discipline as timeliness or completeness.
Together, these conditions create a predictable pattern: when results are unfavourable or ambiguous, upstream design is not revisited; meaning is negotiated through commentary.
Commentary becomes dominant
Commentary fills gaps left by missing structure:
- Where analytical expectations are unclear, narrative substitutes for analysis.
- Where performance management processes are undefined, explanation substitutes for action.
- Where ownership is blurred, narrative substitutes for accountability.
Over time, commentary becomes the default resolution mechanism. The issue is not narrative, but narrative substituting for inspectable reasoning.
Commentary is essential; the failure mode is when it becomes the primary mechanism for interpretation rather than a complement to structure.
Compliance without learning
In this compliance-oriented equilibrium:
- KPIs are populated
- explanations are provided
- reports are delivered on time
- governance processes are satisfied
But structural outcomes quietly degrade:
- analysis remains implicit or inconsistent
- root causes are discussed but not stabilised
- actions are proposed but not tracked systematically
The system produces responses, but not shared understanding.
It moves forward in time, but not necessarily forward in capability.
Why compliance feels rational
The compliance trap persists because it is rational under uncertainty.
Clearer reporting makes performance easier to inspect.
Easier inspection brings sharper questions.
Sharper questions increase accountability and create pressure for sustained action and resourcing.
In environments where incentives are uneven and scrutiny is applied selectively, increased clarity changes who is questioned, who must explain, and who is expected to act.
In such contexts, compliance is a workable equilibrium – oversight is demonstrated, while discretion over interpretation and commitment is retained.
The cost of this compliance equilibrium
The cost of this equilibrium is not immediately visible.
It accumulates gradually, through:
- repeated explanations without resolution
- recurring issues without structural correction
- decisions made on narrative confidence rather than analytical certainty
- insight functions stretched to compensate for design gaps
Over time, performance reporting becomes informationally busy but analytically shallow. The organisation reports more – but understands less.
Why the compliance trap cannot be fixed downstream
Because the compliance trap is stabilised upstream, it cannot be resolved by improving presentation, adding dashboards, or refining commentary.
As long as:
- analytical structure is undefined
- performance management processes are absent
- responsibility for clarity is unclear
the execution cycle will continue to optimise for defensibility rather than understanding.
Structure is missing, so narrative becomes the control surface.
And like most design failures in recurring systems, it does not announce itself.
It simply becomes “how reporting works here”.
The compliance trap is easiest to recognise when a KPI is designed to be visible but not designed to be interpretable by inspection.
Illustrations: How the Compliance Trap Manifests in Practice
The dynamics described above are not abstract.
They appear repeatedly across organisations, sectors, and KPI types.
The following two examples illustrate the same structural failure mode in different guises.
The first uses a non-financial KPI that appears intuitively “soft” and qualitative.
The second uses a core financial KPI that is typically assumed to be analytically mature.
Together, they show that the compliance equilibrium does not depend on KPI type, data quality, or analytical sophistication. It arises from design omissions that recur across contexts.
Customer satisfaction example: No agreed decomposition; no action logic
The following example is a composite illustration based on recurring patterns observed across multiple public-sector organisations. It is not intended to describe any specific agency.
Context
- Sector: Public
- Reporting cadence: Periodic (e.g. quarterly)
- Primary audience: Board, Executive team
What was explicitly designed
- KPI: Customer Satisfaction
Defined using a threshold-based customer survey measure. - Target / threshold:
A fixed percentage target. - Visual structure:
A time-series chart showing actual performance against the target.
This design made overall customer sentiment visible over time and allowed the organisation to state whether it was within expectations.
What was not designed upstream
- Structural analysis expectations:
No agreed decomposition of customer satisfaction (e.g. by service channel, journey stage, customer segment, or operational area).
No defined analytical questions the KPI was expected to answer when it moved. - Performance management process:
No agreed management review cadence beyond reporting.
No explicit action ownership, escalation criteria, or follow-up mechanism tied to the KPI. - Governance clarity:
No clear ownership of customer satisfaction beyond frontline service delivery.
Reporting team responsible for explaining results, but not authorised to define analytical structure or actions.
What happened in the execution cycle
- How results were reviewed:
Senior leaders viewed the customer satisfaction trend and target in the core performance dashboard.
Additional customer feedback material was sometimes circulated for context. - How explanations were produced:
Analysts reused prior-quarter commentary as a template.
Selected themes from customer feedback were referenced to justify movements in the headline measure. - How prior commentary was reused:
Language and framing remained stable across quarters, with only numbers and selected anecdotes updated.
The dashboard showed the outcome.
The supporting feedback material contained detail.
No structure connected the two.
Visibility without structure creates pressure
- What became visible:
The overall customer satisfaction trend was clearly visible, but without structural breakdown.
The organisation could see that performance had moved, but not how or where. - Who felt exposed:
The function most closely associated with service delivery became the focal point for questions, despite lacking authority over many underlying drivers. - What questions could not be answered structurally:
- Which service areas were driving the change?
- Were declines concentrated or diffuse?
- Which issues were controllable vs structural?
- What trade-offs existed between cost, service quality, and satisfaction?
These questions could only be answered verbally, not by inspection.
Resulting equilibrium
When questions arose:
- Reporting redirected questions to service-facing functions.
- Responses relied increasingly on explanation rather than structural diagnosis.
- Commentary expanded, but structure did not.
Over time, the system stabilised around making the KPI result defensible, not around structurally improving customer satisfaction.
The KPI remained visible.
The organisation remained busy.
Learning did not accumulate.
None of these dynamics reflect a lack of effort, concern, or professionalism. They reflect a reporting system that made outcomes visible without designing a corresponding path for diagnosis and intervention.
Minimal redesign move
- Single change that would have shifted the equilibrium:
Embed a governed customer satisfaction decomposition (e.g. by service channel or journey stage, with stable definitions and comparison logic) into the core performance report, with explicit linkage to review ownership and follow-up cadence.
Why this example matters
This example shows that a headline KPI can appear rigorous while remaining operationally hollow.
Detailed feedback and commentary did not resolve the gap because they were not structurally integrated into the reporting and management system.
As a result, customer satisfaction was reported, explained, and defended – but not systematically managed.
Gross margin example: Bridge format without governed decomposition; action ownership undefined
Context
- Sector: Private
- Reporting cadence: Monthly
- Primary audience: Executive team, Finance leadership
What was explicitly designed
- KPI: Gross Margin
Reported as a percentage and dollar variance against budget. - Target / threshold:
Budgeted gross margin. - Visual structure:
A time-series line chart showing actual vs budget margin, accompanied by a high-level margin bridge from budget to actual.
This design made margin movement visible over time and allowed the organisation to state whether performance was “on plan”.
What was not designed upstream
- Structural analysis expectations:
No agreed decomposition logic (e.g. price / volume / mix / cost).
No standardised bridge items or rules governing how margin drivers should be analysed. - Performance management process:
No explicit escalation thresholds tied to margin movements.
No agreed ownership of corrective actions or follow-up tracking linked to bridge items. - Governance clarity:
Finance responsible for explaining margin variance, business units nominally “own” results.
No clear boundary between explanation, challenge, and action.
What happened in the execution cycle
- How results were reviewed:
Executives reviewed the margin trend and bridge as part of the monthly performance pack, alongside revenue and OPEX. - How explanations were produced:
Finance prepared high-level variance explanations using aggregated categories such as pricing pressure, competitive environment, unfavourable mix, or cost inflation. - How prior commentary was reused:
Explanatory language remained stable across cycles, with numbers updated to reflect the current period.
The report showed the variance.
The bridge showed movement.
No structure governed what counted as a valid explanation.
Visibility without structure creates pressure
- What became visible:
Margin erosion was clearly visible, but decomposition remained coarse and inconsistent across periods. - Who felt exposed:
Business unit leaders whose results contributed to margin pressure. - What questions could not be answered structurally:
- Which margin drivers were controllable within the existing operating model?
- Which reflected systemic constraints in pricing, product mix, or cost structure?
- What trade-offs existed between margin protection and volume or growth?
- Which actions would materially change margin, and at what cost?
These questions could only be addressed through discussion, not inspection.
Resulting equilibrium
When questions arose:
- Finance refined the narrative explanation.
- Business leaders contextualised results.
- Accountability diffused across functions.
Over time, the system stabilised around explaining margin variance, not around structurally restoring margin.
The KPI remained visible.
The analysis repeated.
Action remained discretionary.
Minimal redesign move
- Single change that would have shifted the equilibrium:
Embed a governed margin decomposition (e.g. price–volume–mix–cost by category, with stable definitions) into the core report, with stable bridge logic and explicit linkage to action ownership.
Why this example matters
This example shows that even a core financial KPI – assumed to be analytically mature – can stabilise around explanation rather than improvement.
Despite strong data and mature finance capability, the system still stabilised around explanation because decomposition and action ownership were not governed.
As a result, gross margin was monitored, explained, and normalised – but not systematically managed.
The two examples show that the compliance equilibrium is not confined to “soft” metrics or immature reporting; it persists even where financial discipline and analytical tooling are assumed to be strong.
5. Inspectability and the Ownership Gap
The compliance equilibrium is sustained not only by design-layer omissions and execution-cycle constraints, but also by a mechanism that activates pressure once performance is made visible: inspectability – the ability to examine causal logic without narrative mediation.
Clarity does not merely improve understanding.
It makes performance inspectable.
And inspectability has consequences.
Accountability is determined by governance. Inspectability does not change it – it reveals it.
What changes is not accountability itself, but the cost of avoiding it.
Clarity makes performance inspectable
When performance reporting is structurally clear:
- measures are interpretable without narrative defence
- comparisons are stable and explicit
- drivers are visible rather than inferred
- explanations can be inspected rather than accepted
This shifts the role of reporting from presentation to examination.
Results no longer speak only through commentary.
They can be questioned, tested, and challenged through structure.
This is precisely why clarity matters – and also why it is not neutral.
Inspectability redistributes accountability pressure
As performance becomes more inspectable, accountability pressure changes. Existing accountability arrangements are no longer implicit; they are forced into view.
Clear structure:
- concentrates attention on particular measures and roles
- exposes gaps between outcomes and explanations
- reduces room for narrative discretion
- shortens the distance between results and responsibility
In environments where accountability is uneven, inspectability is experienced unevenly.
This is not a moral failure.
It is a structural effect.
Why ownership becomes contested
As inspectability increases, a practical question arises:
who owns performance beyond the numbers?
In many organisations:
- reporting teams produce results
- business units explain results
- no one clearly owns the management of performance
When performance management processes are undefined, inspectability creates tension without resolution. Results can be seen more clearly, but responsibility for acting on them remains ambiguous.
In this context, clarity becomes uncomfortable, not because it creates new accountability, but because it exposes gaps in ownership that the system is not designed to absorb.
Reporting teams pulled into the ownership gap
When ownership is unclear, reporting teams are often pulled into the gap. They are asked to:
- add more explanation
- provide context
- design follow-up processes
- “close the loop”
This may appear pragmatic, but it blurs roles.
Reporting teams can enable performance management, but they cannot own it without undermining segregation of duties. When they do, accountability is displaced rather than resolved. Clarity may be increased at the surface, but governance is weakened underneath. Inspectability increases pressure on these boundaries, but it cannot redefine them.
A clear performance reporting system depends on a clear separation of roles:
- business leaders own performance outcomes and actions
- reporting teams design, analyse, and make performance visible
- governance roles provide oversight and challenge
When these boundaries blur, the system compensates through narrative rather than structure. Clarity becomes something individuals are expected to supply, rather than something the system is designed to support.
Clarity as a design and governance problem
Without explicit ownership of action setting, tracking, follow-up, and evaluation, clarity reaches a ceiling.
Reports can become cleaner. Dashboards can become more consistent.
But understanding does not reliably translate into improvement.
The limits of clarity in performance reporting are therefore not primarily technical, visual, or communicative. They are design and governance limits. Clarity can reveal accountability, but only governance can resolve it.
Until organisations decide:
- what performance reporting is for
- who owns performance beyond reporting
- how inspectability should be handled
clarity will remain fragile – dependent on individual judgement, goodwill, and informal influence.
6. Structural Analysis: The Missing Upstream Layer
A recurring absence has appeared throughout the preceding sections.
Performance reporting systems define what will be measured.
They rarely define how those measures are meant to be analysed.
What structural analysis is
Structural analysis is the explicit analytical structure that sits between raw measures and interpretation.
At a minimum, structural analysis defines:
- which comparisons are expected and meaningful
- how performance should be decomposed when results move
- which drivers are relevant, and which are not
- what constitutes a valid explanation versus a superficial one
- how consistency is maintained across time, scenarios, and audiences
In other words, it makes causal reasoning inspectable.
Without this structure, analysis exists only as individual judgement – variable in quality, inconsistent in logic, and difficult to govern.
Defined measures, undefined analysis
In most organisations, considerable effort is invested in defining:
- measures and calculations
- targets and thresholds
- data dictionaries and stewardship
What is rarely formalised is the analytical logic that should accompany those measures.
The consequence is predictable:
- explanations vary by individual, not by design
- “analysis” becomes whatever fits the execution cycle
- quality assurance is often strongest on numerical accuracy and lineage, and weaker on analytical coherence
The system governs data correctness, but not analytical soundness.
When narrative becomes the control surface
When the analytical layer is missing upstream, the gap is filled downstream through narrative.
Commentary becomes the control surface: the place where meaning is shaped, tension is resolved, and acceptability is negotiated.
This produces familiar failure modes:
- cherry-picking favourable comparisons
- selective context that frames results defensively
- “explaining away” adverse outcomes without structural diagnosis
- shifting emphasis between periods, peers, or metrics
- conclusions that cannot be re-tested or reproduced
These behaviours are not necessarily dishonest. They are predictable when analytical structure is left implicit.
Ad-hoc analysis is not neutral
Ad-hoc analysis is often framed as flexibility.
In practice, it has systematic consequences:
- analytical quality varies by individual capability
- explanations depend on confidence and persuasion, not structure
- reasoning cannot be reliably inspected or challenged
- learning does not accumulate across cycles
Over time, the organisation becomes dependent on who is analysing, rather than how analysis is meant to work.
Why assurance rarely corrects the gap
The absence of structural analysis is not typically challenged by assurance processes.
In assurance reviews and audits of performance reporting, attention is usually directed towards:
- the definition of measures
- the completeness of data dictionaries
- data extraction and transformation logic
- calculation accuracy and traceability
Auditors may ask whether measures are well-defined and consistently applied.
They may even question the rationale for selecting certain measures.
They rarely examine how those measures are meant to be analysed.
The analytical process – how performance is interpreted, decomposed, and explained – remains largely outside the scope of formal assurance.
As a result, organisations receive strong incentives to document data lineage, but weak incentives to design analytical reasoning structures.
The omission is therefore reinforced, not corrected.
Why finance can look different
The contrast with financial analysis is instructive.
In well-run finance functions, it is widely accepted that:
- numbers require structure to be meaningful
- variance analysis follows defined logic
- bridges, reconciliations, and driver decompositions matter
- analysis can be reviewed, challenged, and repeated
These expectations are embedded in professional standards, modelling conventions, and shared practice. Even then, those disciplines often remain confined to financial outcomes and do not automatically extend to non-financial performance or cross-functional operating drivers.
Performance reporting rarely enjoys the same analytical discipline, not because performance is less complex, but because the analytical layer was never designed into the system.
Structural analysis belongs upstream – but belongs to no one
Structural analysis sits in an uncomfortable position.
It is:
- not merely reporting
- not yet performance management
As a result, it often belongs to no one.
Reporting teams are expected to “analyse”, but without authority to define standards.
Business teams explain outcomes, but without a shared analytical framework.
Governance forums approve definitions, but not reasoning structures.
The layer exists only implicitly.
Structural analysis as an upstream design responsibility
Structural analysis cannot be bolted on during the execution cycle; it must be designed upstream – alongside KPI selection, measure definitions, benchmark design, visual structure, and review cadence.
Without this, clarity remains dependent on individual effort rather than system design. It is a design omission.
And until this omission is addressed, performance reporting will continue to rely on narrative as its control surface – reinforcing cherry-picking, selective context, and explain away behaviour – and limiting clarity, inspectability, and learning.
Where missing structural analysis naturally leads
With structural analysis missing, reporting cannot reliably connect to action. That gap points directly to the next layer:
performance management – how results are reviewed, acted upon, and followed through.
That is the next missing system.
Structural analysis is the layer that translates performance reporting into performance management. It provides the reasoning structure needed to move from results to decisions, and from decisions to action.
Reporting makes performance visible.
Structural analysis makes meaning inspectable.
Performance management makes action repeatable and reviewable.
When any link is missing, the system defaults back to narrative and discretion.
7. Performance Management: The Missing System
Structural analysis explains performance and forms the bridge between performance reporting and action. Performance management is the system that acts on it.
In many organisations, performance management as a designed, governed process is either weakly defined or absent altogether.
Performance reporting exists.
Performance management often does not.
Reporting without management
Reporting answers: How did we perform?
Performance management answers: What will we do about it – and how will we know whether it worked next cycle?
In practice, the second question is frequently left implicit.
The design layer typically defines measures, cadence, and audiences.
But it rarely defines:
- how results will be reviewed
- how issues will be prioritised
- how actions will be identified
- who owns those actions
- how follow-up will occur
- how outcomes of actions will be evaluated
The system is designed to observe performance, not to manage it.
Why action does not naturally follow insight
It is tempting to assume that better insight naturally leads to better action.
However, without a performance management system:
- insights compete for attention
- actions are proposed informally
- ownership is ambiguous
- follow-up depends on goodwill
- outcomes are not systematically revisited
The same issues resurface across cycles, explained repeatedly but resolved rarely.
The problem is not lack of insight.
It is lack of structure around action.
When reporting teams get asked to “close the loop”
When performance management is missing, pressure shifts to reporting teams. They are often asked to:
- facilitate performance discussions
- build action trackers
- follow up on delivery
- monitor outcomes
- “make sure something happens”
This is understandable, but structurally risky: reporting teams can support performance management, but they cannot own it without collapsing segregation of duties.
Performance management cannot be improvised
Performance management is not a by-product of reporting.
It is a system in its own right.
At a minimum, it requires explicit design of:
- review forums and cadence
- criteria for escalation and prioritisation
- standards for defining actions
- clear ownership of actions
- mechanisms for tracking progress
- feedback loops linking actions to outcomes
When these elements are absent, actions remain episodic. They respond to individuals rather than forming a sustained management cycle.
Learning does not accumulate.
Capability does not compound.
Clarity without management reaches a ceiling
Even the clearest reporting system has a natural limit.
Without performance management:
- insight does not translate into action reliably
- action does not translate into learning consistently
- improvement remains dependent on individuals, not systems
Reporting satisfies oversight. Narrative manages exposure. Action remains discretionary.
The organisation sees more –
but does not improve proportionally.
8. Governance Asymmetry and Segregation of Duties in Practice
Where performance management is absent, clarity increases scrutiny without increasing capacity to respond – which is why governance asymmetry becomes decisive.
The pattern is consistent.
Clarity in performance reporting depends on:
- upstream design
- explicit structural analysis
- performance management
- clear ownership of outcomes and actions
And yet, in practice, many organisations stop short of completing this system.
The reason is not lack of awareness or capability.
It is governance asymmetry.
Governance operates as a gradient
Formal governance frameworks often assume a uniform “leadership mindset”.
In practice, governance is unevenly distributed.
At the top of the organisation – typically the CEO and CFO – governance incentives are explicit:
- accountability to boards, ministers, regulators, or the public
- responsibility for organisational outcomes, not local optimisation
- acceptance that scrutiny is inherent to the role
At this level, clarity is often welcomed.
Inspectability is part of the job.
One level down, incentive structures tighten: scrutiny feels more personal, discretion is more valuable, and measures are more tightly coupled to local resourcing and reputation.
The same increase in clarity is experienced very differently.
Why resistance concentrates below the top
This asymmetry explains a recurring pattern.
Initiatives that formalise structural analysis and performance management may be supported by senior executives, yet resisted or stalled lower down.
Not because leaders oppose improvement, but because these structures:
- increase local inspectability
- reduce narrative discretion
- commit resources
- limit the ability to manage exposure informally
From that vantage point, the system feels more demanding, not more helpful.
This is not a character issue.
It is an incentive issue.
What this does to segregation of duties
In theory, segregation of duties is clear:
- business leaders own performance and actions
- reporting teams provide visibility and analysis
- governance roles provide challenge and oversight
Under governance asymmetry, these boundaries blur.
When performance management is weak and scrutiny increases:
- reporting teams are asked to design processes they do not own
- reporting teams are asked to facilitate action without authority
- analysts are pulled into operational decision-making
- objectivity is quietly compromised
Accountability is not strengthened. It is redistributed informally.
Two recurring patterns
Governance asymmetry becomes most visible when the same performance measure is treated differently across contexts.
Pattern 1: Clarity constrained – escalation required
It is not uncommon for a KPI to be reported externally under one governed definition, while internally it is recalculated or reframed for operational comfort. This preserves compliance but fractures clarity. Resolution often depends on escalation to a level that can absorb inspectability.
Pattern 2: Clarity designed – escalation unnecessary
In more mature systems, definitions and targets cascade consistently. Inspectability is institutional rather than negotiated. Clarity holds because it is carried by design.
Why partnering becomes the default stance
In environments shaped by governance asymmetry, reporting teams often adopt a careful posture:
- partnering rather than owning
- facilitating rather than directing
- advising rather than deciding
This is not evasion.
It is a rational response to unclear authority and uneven accountability.
Owning performance management without mandate would violate segregation of duties and expose the team to political and operational risk.
Clarity is therefore pursued indirectly, through influence rather than structure.
What this explains
Governance asymmetry helps explain why:
- structural analysis remains implicit
- performance management stays “out of scope”
- commentary dominates
- reporting teams are repeatedly rehomed
- compliance feels safer than clarity
The system is coherent under its incentives.
Clarity cannot override governance
Clarity cannot override governance. It must operate within a governance design that can absorb it.
Without:
- explicit ownership of performance management
- protected segregation of duties
- alignment between accountability and authority
clarity will remain conditional, negotiated, and unevenly applied.
That is why many performance reporting reforms fail quietly.
They focus on dashboards, metrics, standards, and storytelling –
while the real constraint is governance capacity.
9. What Clarity Means and what it requires in Performance Reporting
By this point, it should be clear that clarity in performance reporting is not a matter of presentation skill, visual polish, or storytelling ability. It is functional.
Clarity exists when performance can be understood, interrogated, and acted upon consistently over time, across audiences and reporting cycles – without relying on ad hoc explanation or individual interpretation.
That requires more than good charts.
It requires clarity across several distinct dimensions.
Clarity is semantic
Semantic clarity answers the most basic question:
What does “performance” mean here?
A performance reporting system has semantic clarity when:
- measures have stable, agreed definitions
- benchmarks and targets are explicit and consistently applied
- success and failure are framed unambiguously
- internal and external meanings of measures do not diverge
When semantic clarity is weak, performance becomes negotiable.
The same result can be framed differently for different audiences, and meaning shifts without formal change.
Semantic clarity does not eliminate debate.
It ensures debate happens on shared ground.
Clarity is analytical
Analytical clarity answers a deeper question:
How is performance meant to be interpreted?
A system has analytical clarity when:
- expected comparisons are defined rather than improvised
- drivers and decompositions are structured, not selected opportunistically
- explanations can be inspected, challenged, and repeated
- analytical reasoning is consistent across time and teams
Without analytical clarity, analysis migrates into narrative.
Interpretation depends on who is speaking, not on how reasoning is designed.
Analytical clarity exists when interpretation can be re-tested, not merely asserted.
Clarity is managerial
Managerial clarity addresses the action gap:
What happens when performance moves?
A performance reporting system has managerial clarity when:
- review cadence is explicit
- escalation criteria are defined
- actions have clear ownership
- follow-up and outcomes are tracked
- learning accumulates across cycles
Without managerial clarity, insight does not reliably lead to action.
Performance is discussed repeatedly, but managed episodically.
The organisation sees more –
but improves inconsistently.
Clarity is governable
Governance clarity answers a question that is often left implicit:
Who owns what – and why?
A system has governance clarity when:
- reporting, analysis, and management roles are distinct
- segregation of duties is protected rather than blurred
- accountability aligns with authority
- inspectability is carried by design, not negotiated ad hoc
Without governance clarity, clarity itself becomes risky.
Insight exposes gaps the system is not designed to handle.
As a result, clarity is selectively applied –
welcomed in principle, constrained in practice.
Clarity is systemic, not local
These dimensions do not operate independently.
Semantic clarity without analytical clarity produces stable but shallow reporting.
Analytical clarity without managerial clarity produces insight without impact.
Managerial clarity without governance clarity creates tension and role conflict.
Clarity emerges only when these dimensions reinforce one another. It is therefore a system property, not a dashboard property.
What clarity is not
Clarity in performance reporting does not mean:
- fewer or simpler measures
- simplified narratives
- visually minimal dashboards
- consensus on interpretation
Complex performance environments remain complex.
Clarity does not remove complexity.
It makes complexity legible, inspectable, and actionable.
Why this definition matters
Without a shared understanding of what clarity actually requires, organisations pursue it piecemeal:
- improving visuals without stabilising meaning
- demanding insight without defining analysis
- asking for action without designing management processes
The result is frustration rather than improvement.
Defining clarity precisely is therefore not an academic exercise.
It is a prerequisite for designing a performance reporting system that can actually carry it.
10. Designing an Operating Model That Can Carry Clarity
If clarity is a system property, then it cannot be sustained by any single team, role, or artefact. It must be carried by an operating model: stable responsibilities, interfaces, and decision rights that together support semantic, analytical, managerial, and governance clarity over time.
This is not primarily a question of where reporting sits on the organisation chart.
It is a question of how responsibilities are distributed and connected.
From reporting output to operating system
Many organisations implicitly treat performance reporting as an output-producing function: prepare data, publish results, provide explanations. In this model, clarity is expected to emerge downstream – through better visuals, stronger narratives, or more capable individuals.
A system designed to carry clarity works differently. It treats performance reporting as an operating system that connects:
- meaning (what performance is)
- reasoning (how it is interpreted)
- action (what is done about it)
- accountability (who owns outcomes)
Clarity emerges not from any one component, but from the interfaces between them.
Without an operating model that can carry clarity, even the best-designed reports will eventually regress into narrative, negotiation, and compliance.
With one, clarity does not need to be defended or escalated. It holds.
Four functions, not one team
A performance reporting system that can carry clarity relies on four functional roles.
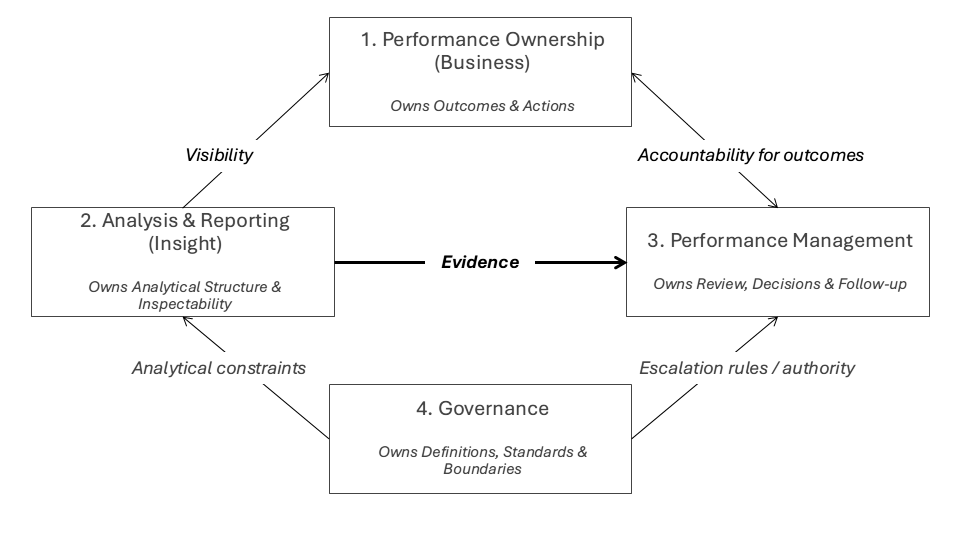
1. Performance ownership (business)
Own outcomes, decisions, trade-offs, resources, and actions. Accept inspectability as part of ownership.
2. Performance analysis and reporting (insight)
Own structural analysis design, analytical standards, comparison logic, and semantic/visual consistency. Make performance inspectable. Do not own outcomes or actions.
3. Performance management (management layer)
Own structured reviews, prioritisation, action agreement, follow-up, and linking actions to outcomes.
4. Governance and assurance
Protect consistency of definitions and analysis; arbitrate disputes; align internal and external reporting; protect segregation of duties.
These functions can be embodied in existing roles; the point is clarity of decision rights and interfaces, not organisational proliferation.
Interfaces matter more than reporting lines
Clarity degrades when:
- analysis is expected without standards
- action is expected without authority
- accountability is demanded without inspectability
- reporting is asked to substitute for management
A viable operating model makes these boundaries explicit and respected.
A minimum viable redesign (what to change first)
A full operating model redesign is rarely feasible in one step. A practical starting point is a minimum viable redesign applied to one reporting domain (one portfolio, one directorate, or one performance pack):
- Govern semantic meaning: one governed KPI definition and target logic, with explicit change control.
- Standardise decomposition: one agreed driver logic (bridge, breakdown, rate/volume/mix) for each critical KPI.
- Separate roles explicitly: reporting owns the structure and analysis logic; business owns actions; governance arbitrates disputes.
- Create a review loop: at least one internal forum where performance is reviewed against agreed structure, with action ownership, due dates, and outcome review in the next cycle.
This is often enough to shift the system away from narrative dependence and towards inspectable reasoning, without requiring organisation-wide re-wiring.
Designing for governance asymmetry
Governance capacity is uneven. A realistic operating model does not assume uniform appetite for inspectability; it designs for it:
- anchor meaning and analysis at a level that can absorb scrutiny
- protect insight teams from owning outcomes
- ensure performance management has authority, not just responsibility
- avoid reliance on escalation as the primary resolution mechanism
Clarity should not depend on who is willing to absorb pressure in a given cycle.
It should be carried by design.
What this operating model avoids
A system designed to carry clarity deliberately avoids:
- collapsing reporting and management into one role
- relying on narrative to resolve structural gaps
- using dashboards as substitutes for decision processes
- treating clarity as an individual capability problem
Instead, it distributes clarity across roles – and sustains it through structure.
Clarity as an operating condition
When these roles and interfaces are in place:
- measures mean the same thing across audiences
- analysis is consistent and inspectable
- performance conversations focus on capability and action
- accountability is visible but not personalised
- learning accumulates across cycles
Clarity stops being fragile.
It becomes an operating condition.
Conclusion: Clarity Is a Design Choice
Performance reporting rarely fails because organisations lack data, tools, or capable people. It fails when clarity is expected to emerge from a system not designed to carry it.
Clarity in performance reporting depends on the upstream design layer, explicit structural analysis, a defined performance management process, and governance arrangements that can absorb inspectability without displacing accountability.
Where these elements are missing, reporting systems stabilise around compliance rather than understanding. Narrative substitutes for structure. Explanation substitutes for action. Escalation substitutes for design. The system functions – but with avoidable limits on learning and intervention.
This outcome is not irrational. It reflects governance asymmetries and role ambiguities that make compliance feel safer than clarity.
The contrast between systems that fragment clarity and those that scale it points to a simple conclusion:
clarity is not a personality trait, a visual style, or a reporting technique.
It is an organisational capability – and therefore a design choice.
When performance reporting is treated as an operating system rather than an output, meaning stabilises. Reasoning becomes inspectable. Action becomes systematic. Learning accumulates.
This does not make performance management easy.
But it makes it honest.
Ultimately, the question is not whether organisations want clearer performance reporting.
It is whether they are willing to design the analytical, managerial, and governance systems that clarity requires.
© 2026 Colin Wu. All rights reserved.
Quotations permitted with attribution. No reproduction without permission.