Structural Analysis Is the Inverse Problem of Modelling

Why performance analysis must infer the structure that modelling formalises?
A financial model begins with stated premises. It identifies relevant drivers, specifies the conditions in which they operate, defines how they combine and calculates the resulting outcomes. Performance analysis usually begins with much less. The outcome is visible – revenue is below plan, expenditure has increased or service performance has deteriorated – while the structure that produced it may still be unknown. The analyst must identify possible relationships, drivers and conditions, then test them against incomplete evidence.
The two directions can be expressed simply:
- Forward modelling: drivers + underlying conditions → quantified structure → outcomes
- Structural analysis: observed outcomes + available evidence → candidate structures → tested explanation
Both concern the same kind of analytical structure, but start from opposite ends. Modelling begins with a structure already stated; structural analysis must first infer which structure the evidence supports.
I use inverse problem here in a broad sense. In its narrower mathematical use, the forward structure is often already known and the task is to recover unknown inputs or parameters. In performance analysis, the form of the structure itself may also be in question.
The directions therefore involve different kinds of reasoning. Once a candidate structure and its premises have been stated, running the model forwards is primarily deductive: what follows from these assumptions? Structural analysis is inferential: given an observed result and incomplete evidence, what combination of structure, drivers and conditions could have produced it?
This distinction concerns the direction of reasoning. Model design itself may involve substantial inference, calibration and structural analysis. Once the structure has been formalised, however, its forward calculation is defined. In the inverse direction, the premises themselves remain open to question.
The same structure, different reasoning
A model begins with a proposition about how something works. At its simplest:
Price × Volume = Revenue
The arithmetic is straightforward. The intellectual work lies in deciding whether price and volume are the right drivers, how they should be defined, at what level they should be modelled and which conditions affect their relationship.
Volume might mean units ordered, delivered or accepted by the customer. Price might mean list price, realised price or net price after rebates. Customer mix may sit within price and volume or require separate treatment. Timing effects may also need to be represented explicitly.
These questions concern the business mechanism through which the outcome is produced. Once that mechanism has been understood, modelling formalises it as a quantified analytical structure and asks: given these drivers, conditions and relationships, what outcome follows?
Performance analysis begins at the other end. It asks which drivers, conditions and relationships could explain the observed outcome. The analyst must propose candidate structures, work out what each would imply and test those implications against the available evidence.
Several candidates may initially appear plausible. Relevant drivers may not have been measured, relationships may have changed, and a relationship may predict the outcome without representing the mechanism that produced it. A good predictive fit therefore supports a candidate structure without proving how the outcome arose. Further evidence will often narrow the candidates to one dominant explanation, or show that several mechanisms contributed. The conclusion should emerge from testing the candidates rather than from selecting an explanation in advance.
Two definitions help clarify the task. Drivers are factors whose changes affect the outcome. Underlying conditions shape, constrain or alter how those drivers operate. The boundary depends on the decision being examined: an exchange rate may be an external condition in a sales-volume model, but a modelled driver in a treasury or hedging decision.
An analytical structure shows, in quantified form, how drivers, underlying conditions and other measures combine to produce a result. In its primary forms, it represents a business mechanism. In its derived and adjusted forms, it composes or modifies the results those mechanisms produce.
Structural analysis connects the business mechanism with its quantified representation.
Reconstructing the analytical structure
Identifying possible drivers is only part of the task. The analyst must also determine how those drivers, conditions and other measures combine. Five recurring forms provide a working classification of analytical structures. The first three – exchange, processing and capacity – describe primary business mechanisms. The final two are secondary result structures: derived structures build results from other measures, while adjusted structures modify a base result.
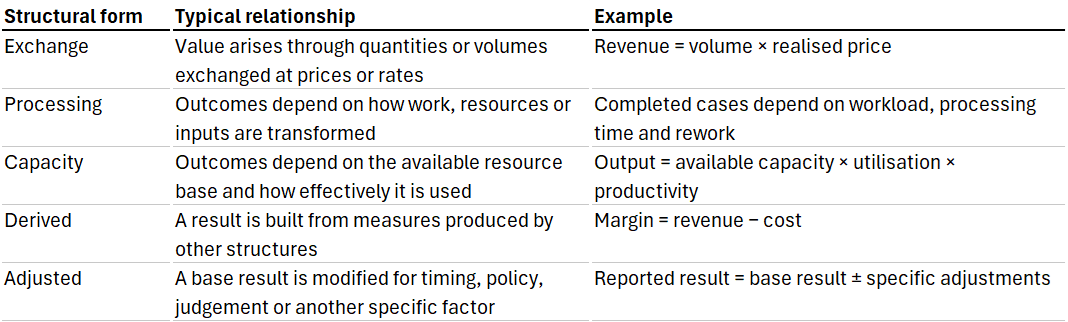
All five belong in the same classification because an analytical structure may need to represent business mechanisms, build results from those mechanisms and apply specific modifications. Their roles differ, but they can operate together within the same model or analysis.
This classification is a practical guide for generating candidate explanations, rather than a complete list of every possible structure. The forms can be nested and combined within the same analysis. A model may contain exchange, processing and capacity mechanisms, build derived measures from their results and then apply specific adjustments. Some fields may also need other forms – for example, an explicit stock-and-flow structure for inventory, cash, provisions or headcount.
The classification matters because the same observed result may be consistent with several different structures. A decline in operating margin might reflect lower realised prices or adverse mix within an exchange structure; waste or rework within a processing structure; underused resources within a capacity structure; the interaction of several derived measures; or an adjustment applied after the operating result was calculated.
The headline movement alone cannot reveal which explanation is correct. The five forms therefore help generate candidate explanations:
What kind of quantified relationship might have produced this outcome?
Structural analysis must then determine which candidate the evidence best supports. Partitioning a variance by business unit, account, supplier, product, customer or month may help locate the movement, but it does not identify the mechanism that produced it.
Partitioning asks where the difference sits. Structural decomposition asks which drivers and relationships contributed to it. Causal judgement asks why those drivers or conditions changed.
Suppose workforce expenditure is above budget. A report may show that most of the variance sits within one division, but that only locates the movement. In the forward direction, a workforce model might calculate expected expenditure from headcount, start and departure dates, salaries, hours, vacancies, overtime and contractor usage. In the inverse direction, structural analysis begins with the observed variance and asks which drivers, conditions or relationships developed differently from the model’s premises.
The difference might arise from more employees than planned, higher average salaries, additional hours, vacancies filled earlier than expected, contractors replacing employees, changes in workforce mix, leave provisions or incorrect budget phasing. Each describes a different mechanism and implies a different management response.
The purpose of structural analysis is to identify the smallest sufficient set of quantified relationships capable of explaining the outcome and supporting a decision.
A disciplined analysis moves from what changed, to the structures that might explain it, to what happened in the underlying business process and finally to the explanation best supported by the evidence. A structural decomposition may quantify the contribution of different drivers without fully establishing why those drivers changed. An operational account may suggest cause without measuring contribution. A plausible narrative may do neither.
Because the inverse problem begins with competing possibilities, plausibility alone is insufficient.
Testing candidate structures
The five structural forms help generate possible explanations. Five tests help determine whether a candidate structure is sound enough to support analysis, modelling and decisions.
These are judgement criteria. The relevant time horizon, way of segmenting the data and threshold for a meaningful difference depend on the decision being supported. Causal proof may require evidence beyond these tests; their purpose is to assess whether a structure is coherent, robust and useful for decision-making.
Decision relevance. A useful structure distinguishes management levers from underlying conditions. Pricing, staffing, capacity allocation and process design may be directly actionable. Regulation, exchange rates and customer demand may be outside management’s control, but they still affect assumptions, choices and responses. Explanatory factors therefore include both controllable levers and conditions that inform a decision, response or assumption.
Decision-useful granularity. The structure should operate at the level at which choices are made, trade-offs are assessed and accountability can reasonably sit. A national total may be too aggregated to support action, while individual transactions may be too detailed to reveal a meaningful pattern. The appropriate level may instead be product, customer segment, service type, location or workforce group. Granularity should follow the decision, rather than merely the availability of data.
Stability over the relevant horizon. The structure should remain valid across reporting cycles within the range of its assumptions. The values of the drivers may change, but the mechanism connecting them should not have to be reinvented each month. Where the mechanism itself changes, that change should be made explicit rather than absorbed into a revised trend or unexplained residual.
Consistency when the data is regrouped. Regrouping the data by product, customer, location or period may reveal genuine differences in how the mechanism operates. Those differences should refine the structure rather than cause the explanation to disappear arbitrarily. Where segments operate differently, the distinction should be represented explicitly rather than concealed within an average.
Visible trade-offs and interactions. Where material, the structure should show competing and interacting effects rather than presenting all drivers as independent levers. Higher utilisation may improve unit cost while reducing resilience. Faster processing may lower waiting time while increasing rework. Lower prices may increase volume while weakening margin.
These tests make the choice between competing structures more rigorous. They help distinguish a quantified representation of a business mechanism from a numerical breakdown that fits the available data without representing the mechanism behind it.
Sometimes the evidence cannot clearly distinguish between candidate structures. When that happens, the disciplined response is to retain the competing explanations, state the remaining uncertainty and identify what further evidence would help distinguish between them.
The need for testing follows directly from the difference between the two directions. Deduction can proceed once its premises have been stated. Inference must determine which premises the evidence justifies.
Model the mechanism, not the measure
One of the most common modelling failures is to begin building before the analytical structure has been resolved. Historical data is imported, assumption tabs are created and formulas begin to spread. The model becomes increasingly sophisticated while the business mechanism remains undefined.
The simplest version of this trap is to model the measure rather than what produces it. Revenue is projected from its historical growth rate. Cost is extended from its recent run rate. Demand is forecast from its trend:
Next year’s revenue = current revenue × assumed growth
This may be a useful statistical forecast, benchmark or short-term planning shortcut. Its purpose, however, is to project the measure rather than represent the revenue mechanism. Revenue has effectively been treated as its own driver.
A mechanism-based model would instead represent relationships such as customers × transaction frequency × quantity × realised price, or volume by product and customer segment × price × mix.
The distinction matters because a trend model may predict that revenue will rise by 5%, but it cannot explain what must change for that growth to occur. It cannot distinguish whether growth depends on more customers, greater frequency, higher volume, improved mix or increased prices.
The same issue arises when cost is projected from historical cost. Such a model avoids asking whether expenditure is driven by headcount, hours, rates, activity levels, processing complexity, supplier volumes or capacity decisions.
A model of the measure may describe the expected direction of travel. A model of the mechanism can also show what would need to change in the underlying drivers, which assumptions carry the result and how competing choices interact.
Before calculation begins, the modeller should therefore be able to state clearly the outcome being modelled, the mechanism that produces it, the relevant drivers and conditions, the quantified relationships between them, the level at which those relationships change and the decision the model is intended to support.
These are the same questions structural analysis asks when moving backwards from observed performance. Model design may itself require structural analysis because the premises to be formalised should have a clear basis.
One structure, two directions
Inspecting a dataset alone cannot establish an analytical structure. This is especially true in organisational performance analysis, where available data rarely records every relevant process, policy, decision, constraint or informal working practice.
Data exploration can generate candidate explanations. Statistical and out-of-sample testing can reject weak models. Neither necessarily reveals whether the relationship reflects how the organisation actually produced the result.
Because structural analysis is inferential, close partnership between business and analytical practitioners becomes part of the method rather than merely a feature of stakeholder engagement.
Business knowledge helps generate candidate explanations. Understanding operating processes, decisions, constraints and behaviours reveals which mechanisms could plausibly have produced the outcome. It also helps rule out explanations that fit the numbers but do not fit how the organisation actually works.
Analytical work does the complementary job. It makes proposed mechanisms explicit, turns them into measurable relationships, works out what each would imply and tests them against the evidence.
Business knowledge must therefore be used throughout the process to generate, challenge and refine the analytical structure. Analytical practitioners must also participate in forming the explanation itself, rather than beginning only after the business has decided what happened.
The partnership must work both ways. Business knowledge can challenge models that fit the data neatly but not the business. Analytical evidence can challenge established business beliefs that are no longer supported by the results.
In these settings, neither business knowledge nor analytical technique is reliably sufficient on its own. Business knowledge without analytical discipline may produce persuasive but untested narratives. Analytical technique without business knowledge may produce elegant models of implausible mechanisms.
Structural analysis is therefore a joint reasoning process through which business mechanisms are proposed, constrained, quantified and tested.
Once the forward model and the inverse analysis share an analytical structure, forecasting and performance explanation reinforce each other. Forecast assumptions become testable against actual outcomes. Variance analysis reveals which relationships need refinement. The model improves because performance analysis shows where actual performance departed from the model’s premises.
This creates a learning loop:
Business mechanism → analytical structure → model → outcome → structural analysis → revised structure
A model that is not tested against actual performance gradually becomes detached from reality. Performance analysis that is not connected to modelling repeatedly explains the past without improving the organisation’s view of the future.
Integrated practice does not require one person to perform every task. It requires business and analytical practitioners to construct and test the structure together. Connected properly, the disciplines can explain what happened, identify the mechanism best supported by the evidence and test what would follow if that mechanism changed.
Modelling asks what follows from stated premises. Structural analysis asks which premises the evidence justifies.
© 2026 Colin Wu. All rights reserved.
Quotations permitted with attribution. No reproduction without permission.